Best AG Sensors for Precision Agriculture in 2026?

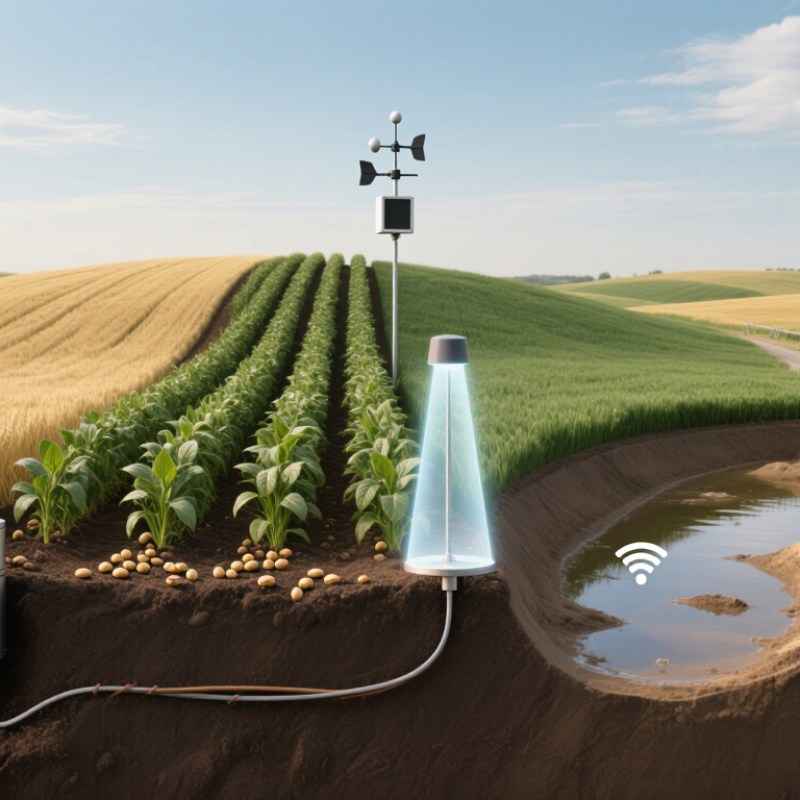
In 2026, choosing the best ag sensors means matching measurements to decisions—not buying the most advanced device. Soil moisture probes can guide irrigation; canopy and leaf sensors can reveal crop stress; weather stations help track local conditions. Each measures something different, and placement matters. A probe near a field entrance may not represent a sandy rise or a low, wet corner. Sensors need context.

The need is practical. FAO reports that agriculture accounts for roughly 70% of global freshwater withdrawals, making better water management important in many regions (FAO AQUASTAT). USDA’s Economic Research Service, in its 2023 review, “Precision Agriculture in the Digital Era: Recent Adoption on U.S. Farms,” documents how precision-technology adoption varies across crops and farm operations. That variation is a reminder: there is no universal sensor kit. For 2026, this guide compares sensor types by accuracy, durability, connectivity, calibration needs, and the decisions they can support. It also considers cost and ease of use, because a sophisticated dashboard is little help if readings arrive late or nobody checks them. Sensors are not magic. Measurements can drift, and even a well-calibrated sensor may miss field-to-field differences. The strongest choice is the one farmers can maintain, interpret, and act on consistently.
Best AG Sensors for Precision Agriculture in 2026?

Understanding Agricultural Sensors in Precision Farming

Agricultural sensors turn field conditions into measurements that support more precise decisions. In precision farming, their value depends on what they measure, where they are placed, and how often readings are checked.

Soil-moisture probes help estimate water availability near crop roots, while temperature sensors reveal conditions that can affect growth. Electrical-conductivity sensors can indicate changes in soil properties, but they do not identify every cause of those differences. Context matters.

Weather stations track rainfall, wind, humidity, and air temperature across a farm. Optical sensors can assess crop vigor by measuring reflected light, though cloudy skies, dust, and growth stage may affect readings.

Placement matters. A sensor beside a field entrance may not represent a low-lying area farther away. Pair sensor data with field observations, such as dry soil at a specific depth or uneven crop color.

Check calibration and compare readings with trusted measurements; a faulty probe can create false confidence. Not every signal deserves a quick response. Soil varies, equipment can drift, and one season’s pattern may not repeat.

Use sensors as decision aids, not substitutes for local knowledge.

Types of AG Sensors and the Data They Collect

Soil sensors measure moisture, temperature, and sometimes electrical conductivity near the root zone. A probe at 20 centimeters can show drying soil before leaves visibly wilt. Weather stations add rainfall, humidity, wind, and canopy-level temperature. FAO’s AQUASTAT database estimates agriculture accounts for about 70% of global freshwater withdrawals, making reliable moisture readings valuable for irrigation decisions. But one probe cannot represent every soil type or slope. Short version: placement matters.

Optical sensors capture reflected light, helping estimate vegetation cover, biomass, and crop stress. Mounted on equipment or carried by aircraft, they can reveal uneven growth that a ground inspection might miss. Yield monitors record harvested flow and moisture, while positioning sensors attach those readings to field locations. USDA’s 2022 Census of Agriculture reported that 27% of U.S. farms used precision agriculture practices to manage crops or livestock. That figure signals growing use, not guaranteed accuracy. Sensors can drift, and cloudy skies or dusty lenses can distort readings. Treating a map as ground truth is an easy mistake. Cross-checking sensor data with crop observations and soil samples gives decisions firmer footing.

Best AG Sensors for Precision Agriculture in 2026: Types and Data They Collect

How to read this chart: These representative intervals show how often data may be recorded or refreshed; actual settings vary by equipment, field conditions, and operation. The logarithmic scale makes both rapid updates and longer imaging intervals visible.

  • GNSS guidance: position and movement, represented here at 10 updates per second.
  • Yield monitor: harvested crop flow and location, represented here at 1 update per second.
  • Weather station: air temperature, humidity, wind, and rainfall, represented here at 5-minute intervals.
  • Soil moisture probe: volumetric water content, represented here at 15-minute intervals.
  • Multispectral imaging: reflected light bands used to derive vegetation indices such as NDVI, represented here with weekly image capture.

How Sensor Data Guides Field-Level Decisions

Field-level decisions start with measurements tied to specific parts of a field, not a single average. Soil-moisture probes at different depths can show whether roots are drawing water from the upper layer or deeper soil. Pair those readings with local rainfall and irrigation records. A dry surface alone may not mean crops need water. Check the root zone.

Canopy temperature and leaf-wetness sensors add another view. A warmer crop section may signal water stress, while prolonged leaf wetness can flag conditions favorable to disease. Satellite or drone images help locate unusual patches, but they cannot explain every cause. Walk the area, inspect leaves, and compare sensor readings with what you see. Small differences matter.

Sensor data is useful when it changes a practical choice: where to irrigate, which zone to scout, or whether to adjust field operations. Set sensors in representative soil and crop conditions, then check calibration and placement regularly. One poorly placed probe can mislead a whole schedule. Data can also be noisy; I would not treat a single reading as a verdict. Trends across days, paired with field notes, usually offer a steadier basis for action.

How to Evaluate AG Sensors for 2026

Evaluating AG sensors for 2026 starts with the job they must perform, not the features listed on a product sheet. A soil moisture sensor, for example, should match the crop’s rooting depth and the soil’s texture. Readings from sandy ground may not mean the same thing as readings from clay. Check stated accuracy, measurement range, and resolution against your field conditions.

Field checks matter. Compare sensor readings with trusted reference measurements at several locations and depths. Repeat checks after installation, because poor placement can distort even accurate measurements. Ask how often calibration is needed and whether temperature, dust, vibration, or moisture can affect performance. No sensor is perfect. The important question is whether its known limits fit the decision you need to make.

Also evaluate data timing and compatibility. A sensor that reports too slowly may miss rapid changes after irrigation or rainfall. Confirm that its data can be exported into your existing farm tools, and ask what happens when connectivity drops. Battery life and maintenance access deserve attention, especially in remote plots. A small trial across contrasting field zones can reveal gaps that a specification sheet misses. The trial may take more time than expected, but skipping it can be costlier. Consider who will inspect, clean, and recalibrate each unit during the season.

Best AG Sensors for Precision Agriculture in 2026? - How to Evaluate AG Sensors for 2026

Compare agricultural sensor types by what they measure, typical outputs, field applications, and the specifications worth checking before purchase.

Sensor Type Primary Measurement Typical Output or Range Best-Fit Applications Key Evaluation Checks
Soil moisture probe (capacitance or FDR) Volumetric water content (VWC) Usually reported as 0–100% VWC. Accuracy is soil- and calibration-dependent; specifications often fall within a few percentage points of VWC. Irrigation scheduling, tracking water movement through the root zone, and comparing moisture across management zones. Check calibration for local soil texture and salinity, sensing depth, installation method, temperature compensation, and whether the probe reports raw or calibrated VWC.
Soil water-potential sensor How strongly water is held by soil Commonly reported in kilopascals (kPa); readings are generally negative relative to free water, with the useful range depending on sensor design. Irrigation decisions where plant-available water is more useful than water content alone. Confirm the operating range, response time, soil contact requirements, maintenance needs, and suitability for the crop’s irrigation thresholds.
Soil electrical-conductivity sensor Bulk or apparent electrical conductivity (ECa) May be reported in mS/m or dS/m. The measurable range and sensing depth vary by instrument and measurement method. Mapping within-field variability, identifying areas for soil sampling, and supporting salinity or management-zone investigations. ECa is affected by moisture, texture, temperature, and salts; it does not directly measure nutrient concentration. Check depth response and ground-truth maps with soil samples.
Soil pH electrode Soil acidity or alkalinity pH scale: 0–14. Electrode specifications commonly state accuracy around ±0.1–0.2 pH under suitable calibration and measurement conditions. Soil-fertility assessment, lime management, and targeted follow-up sampling. Check calibration procedure, electrode durability, soil-contact requirements, maintenance, and whether readings are intended for direct field use or prepared samples.
Weather station and rainfall sensor Air temperature, relative humidity, rainfall, wind, and sometimes solar radiation Typically reports °C, % relative humidity, mm of rainfall, wind speed in m/s or km/h, and solar radiation in W/m². Exact ranges and accuracy are model-specific. Field-level weather monitoring, irrigation planning, frost alerts, and inputs to crop-disease or evapotranspiration models. Check sensor-height and siting guidance, logging interval, radiation shielding, rain-gauge resolution, wind exposure, data connectivity, and local calibration or maintenance needs.
Leaf-wetness sensor Surface wetness duration or relative wetness Often produces a relative wet/dry reading or an index rather than a direct measurement of water depth. Supporting disease-risk monitoring when combined with crop, temperature, humidity, and weather data. Check placement within the canopy, sensor orientation, response to dew and rain, cleaning requirements, and how the output is interpreted by the risk model.
Multispectral crop sensor Reflected light in visible and near-infrared bands Common bands include red near 660 nm, red-edge around 700–740 nm, and near-infrared around 800–900 nm. Vegetation indices such as NDVI are commonly scaled from −1 to +1. Crop-vigor mapping, within-field variability assessment, and identifying areas for scouting or variable-rate decisions. Check band definitions, radiometric calibration, illumination correction, flight or scan consistency, ground resolution, and whether index thresholds are validated for the crop and growth stage.
Thermal infrared canopy sensor Canopy or surface temperature Many thermal systems detect long-wave infrared energy around 8–14 μm; temperature range and stated accuracy depend on the sensor. Detecting canopy temperature patterns that may help assess water stress when interpreted with weather and crop conditions. Check stated temperature accuracy, emissivity settings, viewing angle, distance, sunlight and wind effects, and the need for reference measurements or calibration.
Crop or implement position sensor (GNSS) Geographic position and, where supported, heading Positioning performance ranges from metre-level to centimetre-level depending on the receiver, correction service, signal conditions, and setup. Georeferenced scouting, field mapping, guidance, and recording the location of sensor readings or field operations. Match accuracy to the operation; verify correction availability, repeatability, signal coverage, update rate, antenna placement, and compatibility with mapping and guidance systems.

Evaluation note: Published ranges and accuracy figures vary by sensor model, installation, calibration, soil, crop, and operating conditions. Compare specifications measured under similar conditions, and validate sensor readings against local reference measurements before using them for management decisions.

Integrating Sensors into Farm Equipment and Data Systems

Best AG Sensors for Precision Agriculture in 2026?
Integrating Sensors into Farm Equipment and Data Systems

A sensor is useful only when its reading reaches the right machine at the right time. Mount soil-moisture probes where soil types change, then connect their readings to irrigation controls and field maps. Add implement-mounted sensors for seed spacing, downforce, or crop flow. Keep timestamps and field coordinates consistent. Small mismatches can make a good map misleading.

Integration still takes work. Check whether equipment can exchange data through compatible formats, and test connections before a busy field day. USDA’s Economic Research Service, in its 2016 report Precision Agriculture in the Digital Era, documented growing use of guidance, yield monitors, and related tools on U.S. corn and soybean farms. Adoption varied by technology and farm size. That matters: buying sensors alone does not guarantee useful decisions. A dashboard may show a moisture dip, but a clogged filter or uneven terrain could explain it better than the average reading.

Build a practical data path: sensor, onboard display, farm-management system, then an action the operator can verify. Store calibration dates and note missing readings; dusty housings and loose cables happen. Keep the workflow simple. If workers must re-enter the same data, errors creep in. Review a few fields first, compare sensor readings with manual checks, and revise thresholds when the results disagree.